やりたいこと
Rという統計処理用の言語を使ってデータを適当にグループ分けしてみる。準備
Rをubuntu13.04にインストールする。これはapt-getでOK。
$ sudo apt-get install r-base
$ sudo apt-get install r-cran-*
$ R

R version 2.14.1 (2011-12-22)
Copyright (C) 2011 The R Foundation for Statistical Computing
ISBN 3-900051-07-0
Platform: x86_64-pc-linux-gnu (64-bit)

R is free software and comes with ABSOLUTELY NO WARRANTY.
You are welcome to redistribute it under certain conditions.
Type 'license()' or 'licence()' for distribution details.

  Natural language support but running in an English locale

R is a collaborative project with many contributors.
Type 'contributors()' for more information and
'citation()' on how to cite R or R packages in publications.

Type 'demo()' for some demos, 'help()' for on-line help, or
'help.start()' for an HTML browser interface to help.
Type 'q()' to quit R.

>
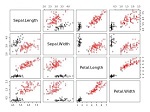
k-meansをirisデータセットに適用する
Rだとk-meansを実装する必要がないから簡単。clusters <- kmeans(iris[1:4], 2)
jpeg("test.jpg", width=640, height=480, pointsize=12, bg="white")
plot(iris[1:4], col=clusters$cluster)
points(clusters$centers, col=1:2, pch=8)
$R --vanilla < kmeans-sample.R