I used to use existing web site to generate colored map for visited countries for fun. But, I need to re-input all countries with the site. So, I tried to develop an app which has load function.
Developed Web Application
I tried to develop the following application. (Sorry, text in the site is only Japanese. When there is no access for a while and application will be in sleep mode, so if you cannot see the app, maybe it’s in sleep mode.)
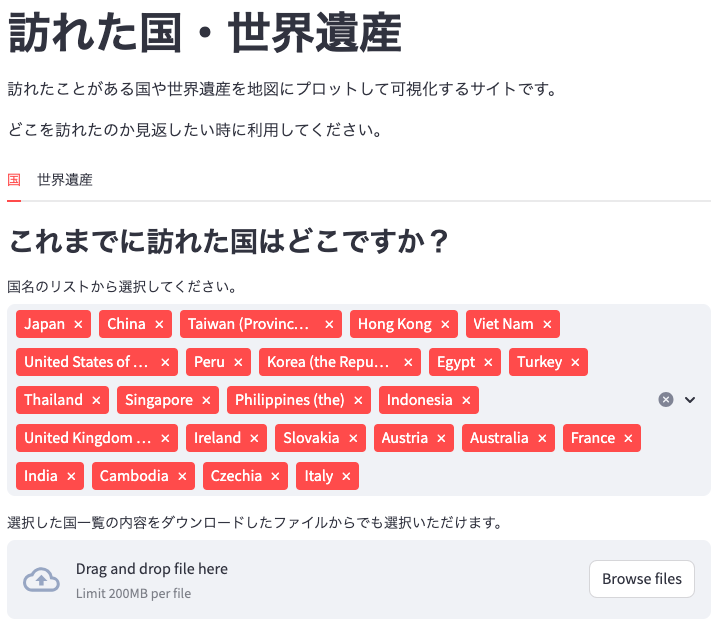
You can select countries by list or file upload like following.
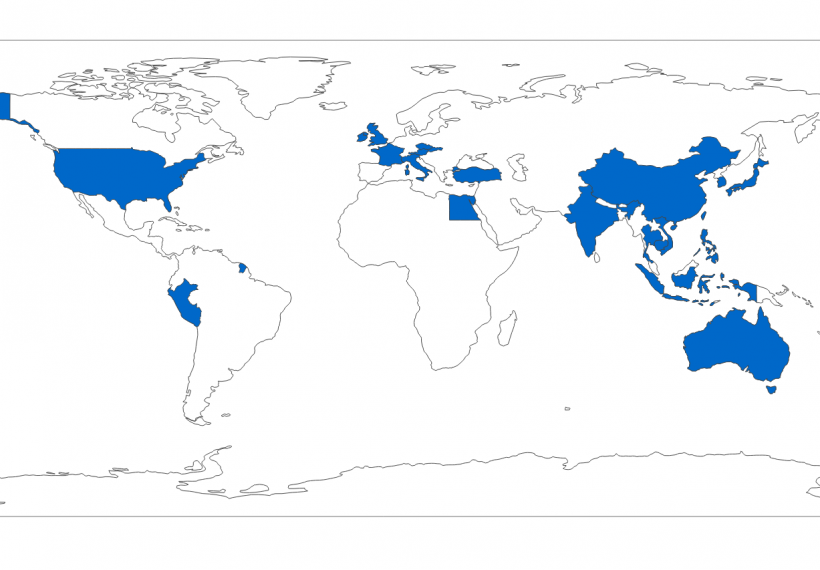
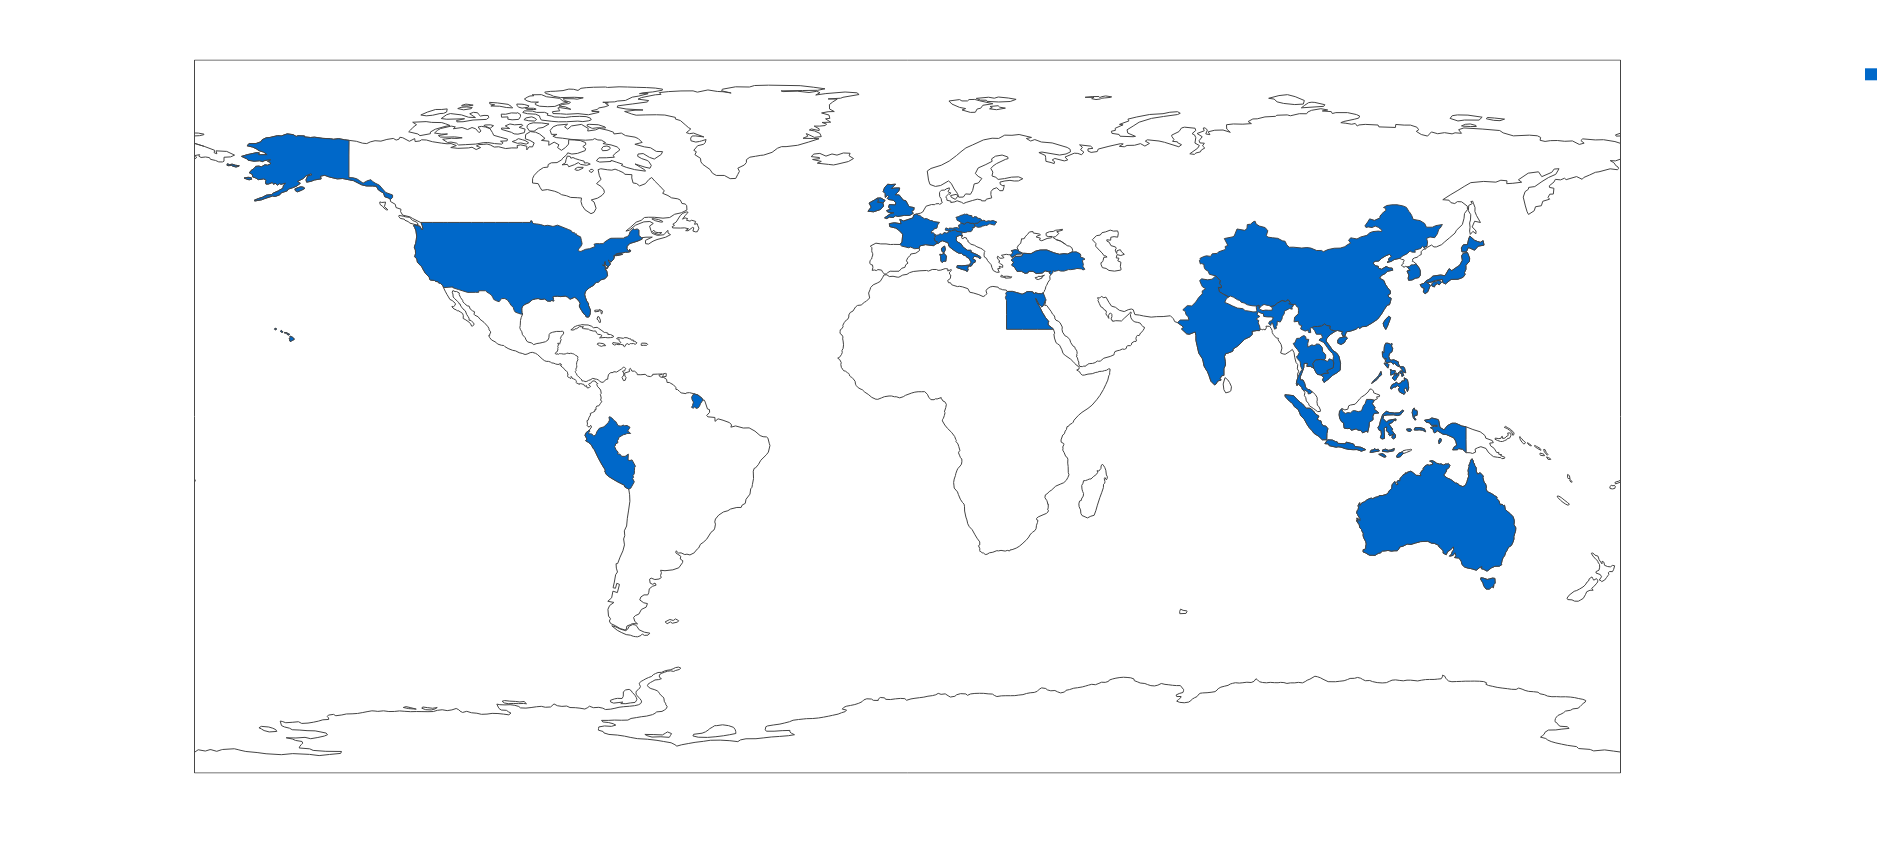
After selection countries, map like following will be generated. Design is not good though.
Code
I used the following packages: streamlit (1.25.0) for UI, plotly-express (0.4.1) for map generation, pandas (2.0.3) for data integration with plotly. Streamlit itself can handle map, but I couldn’t find coloring with country level. That’s why I use plotly-express.
First version code is following.
There is World heritage version in another tab in the application. But, code is kind of same as country one, so I deleted from the following code.
import os
import json

import streamlit as st
import plotly.express as px
import plotly.graph_objects as go
import pandas as pd


COUNTRY_DATA = 'data/countries.json'
WORLD_HERITAGE_DATA = 'data/world_heritages.json'


def on_change_uploaded_file():
    st.session_state['need_rerun'] = True


def on_change_uploaded_file2():
    st.session_state['need_rerun2'] = True


def main():
    # Load country data
    countries = None
    with open(COUNTRY_DATA) as f:
        countries = json.load(f)

    country_list = [c['name_en'] for c in countries]
    default_visited_country = ['Japan']
    if 'default_visited_country' in st.session_state:
        default_visited_country = st.session_state['default_visited_country']

    name_alpha3_dict = {}
    for c in countries:
        name_alpha3_dict[c['name_en']] = c['alpha3']

    # Load world heritage data
    # Skip

    # UI
    st.title('訪れた国・世界遺産')
    st.write('訪れたことがある国や世界遺産を地図にプロットして可視化するサイトです。')
    st.write('どこを訪れたのか見返したい時に利用してください。')

    tab1, tab2 = st.tabs(["国", "世界遺産"])

    with tab1:
        st.write('### これまでに訪れた国はどこですか?')
        options = st.multiselect(
            '国名のリストから選択してください。',
            country_list,
            default_visited_country)
        uploaded_file = st.file_uploader("選択した国一覧の内容をダウンロードしたファイルからでも選択いただけます。",
                                         key='country',
                                         on_change=on_change_uploaded_file)
        uploaded_countries = None
        if uploaded_file is not None:
            uploaded_countries = json.load(uploaded_file)

        data = dict(country=[], country_code=[], number_of_visited=[])
        for c in options:
            data['country'].append(c)
            data['country_code'].append(name_alpha3_dict[c])
            data['number_of_visited'].append(1)
        if uploaded_countries is not None:
            for c in uploaded_countries:
                if c in name_alpha3_dict and c not in options:
                    data['country'].append(c)
                    data['country_code'].append(name_alpha3_dict[c])
                    data['number_of_visited'].append(1)
                    options.append(c)
        st.session_state['default_visited_country'] = options
        df = pd.DataFrame(data=data)

        st.write('### 選択した国一覧')
        st.download_button('Download', json.dumps(options), file_name='visited_countries.json')
        st.write(options)

        if 'need_rerun' in st.session_state and st.session_state['need_rerun']:
            st.session_state['need_rerun'] = False
            raise st.experimental_rerun()

        fig = px.choropleth(df,
                            locations='country_code',
                            hover_name='country')

        st.write('### 世界地図')
        st.write('地図にカーソルを合わせると表示されるカメラアイコンから画像を保存できます。また、左上右下の 2 方向の矢印のアイコンから拡大できます。')
        st.plotly_chart(fig, theme="streamlit", use_container_width=True)

    with tab2:
        # Skip


if __name__ == '__main__':
    main()
There was one difficulty point which file uploading doesn’t update generated map.
Saving uploaded file contents by st.session_state and rerunning by st.experimental_rerun could solve the issue.