Streamlit は Python で Web アプリケーションを簡単に作成できるフレームワークで、streamlit.io でホスティングも簡単にできます。

これまで、今までどこの国に旅行したかを視覚的に見たくて、世界地図の色塗りをしてくれる Web サイトを使っていたのですが、毎回 0 から入力する必要があるのが面倒だったので、Streamlit を使って簡単に作ってみることにしました。
作成した Web アプリケーション
作成した Web アプリケーションの URL は以下です。(一定期間アクセスがないとスリープモードになるようなので、正常に表示されなかったらスリープ状態になっているかもしれません)

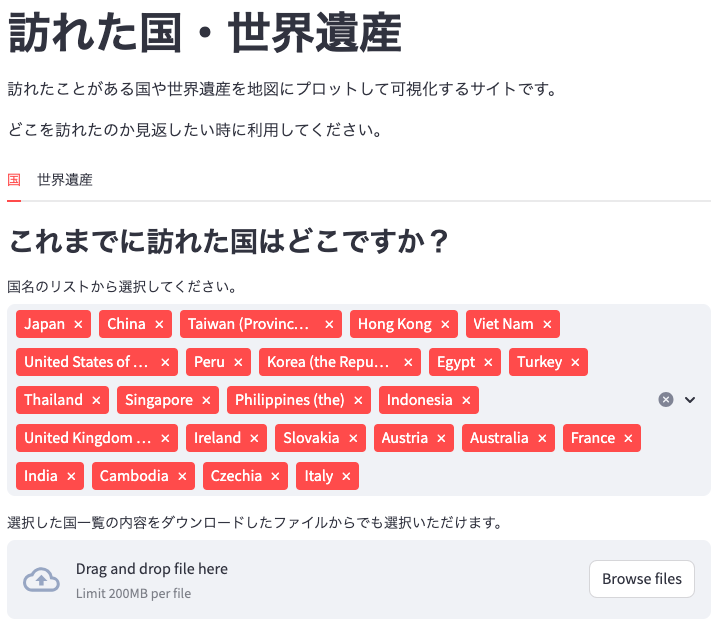
以下のような画面で、リストあるいはファイルをアップロードして国を選択すると、訪れた国だけ色が塗られた世界地図が作成されます。
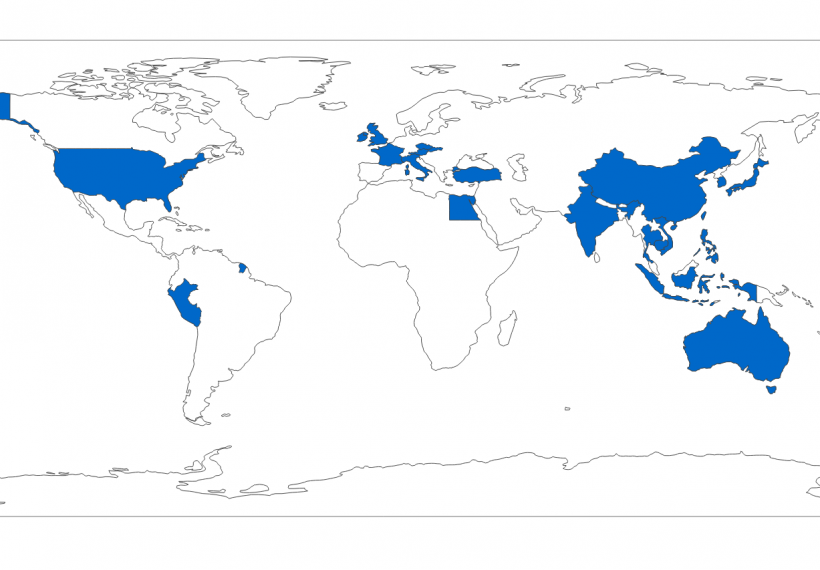
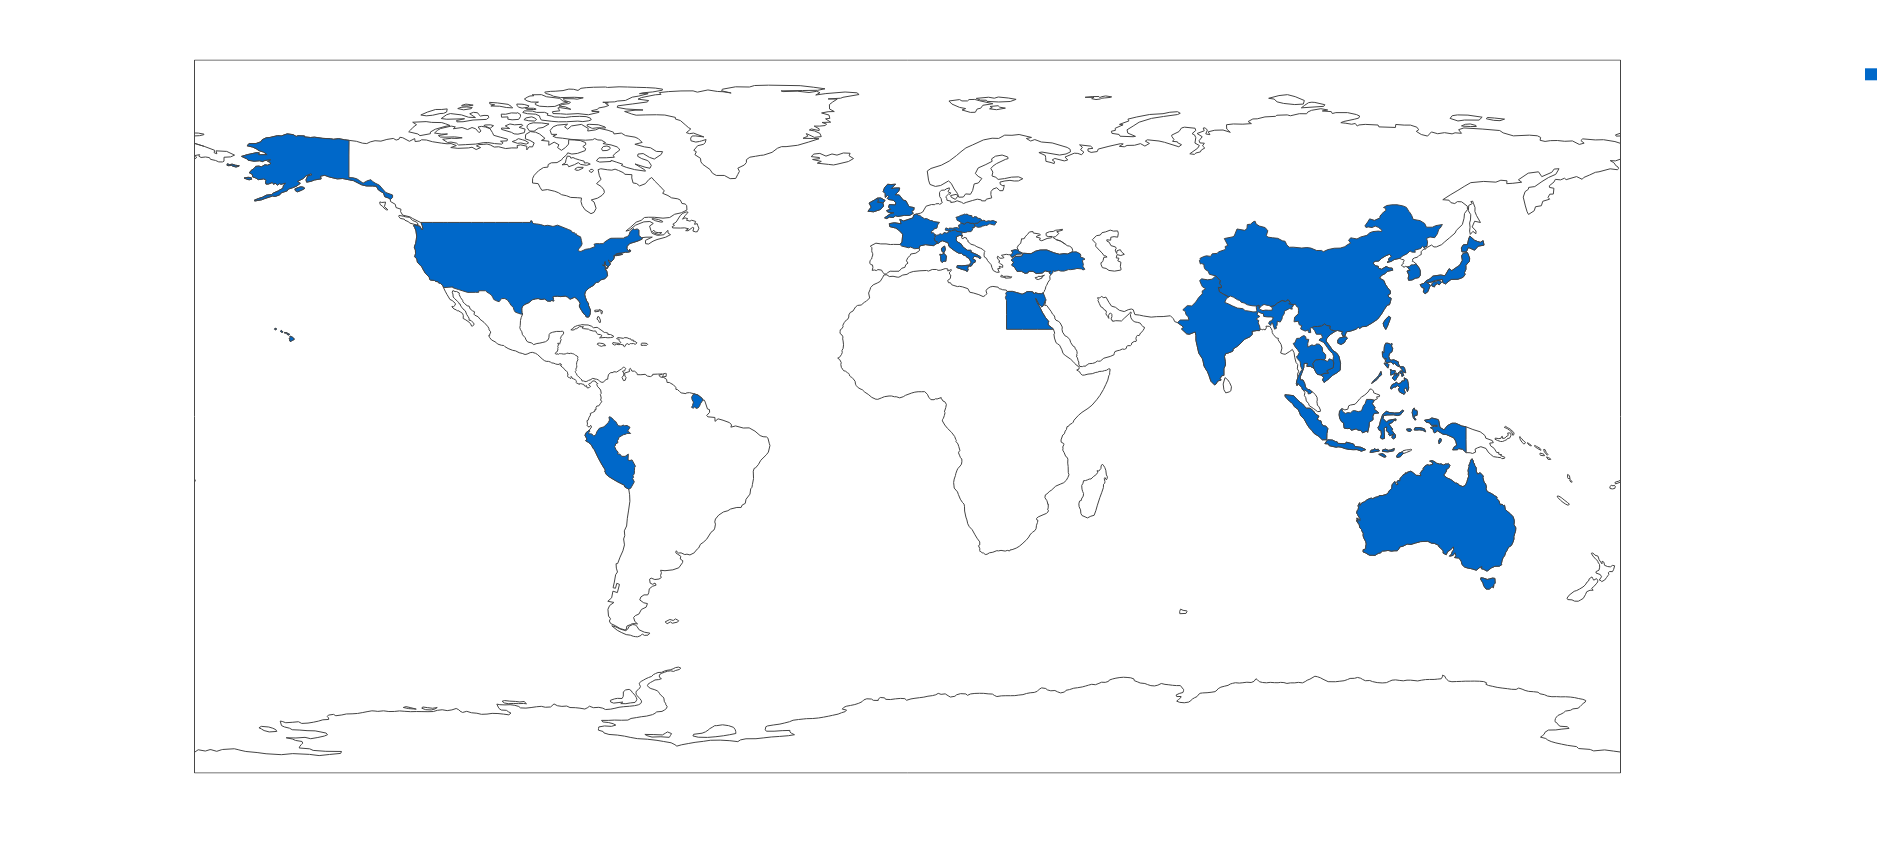
見栄えは良くないですが、作成される世界地図は以下のような感じです。
上のアプリケーションの画面にあるように、訪れた世界遺産の位置に点をうった世界地図を作成する機能もつけてみました。
コード
パッケージは UI 用に streamlit (1.25.0)、世界地図作成用に plotly-express (0.4.1)、plotly-express にデータを連携するために pandas (2.0.3) を使いました。streamlit 単体でも世界地図を生成できますが、国レベルで色を塗る方法が見つからなかったので、plotly-express を使いました。
一旦思ったとおり動いた時のコードは以下です。とりあえず動かしたかったので、綺麗にしていないのと力技のコードになっています。
世界遺産 (tab2) の方は国とほぼ同じなので、省略しました。
import os
import json

import streamlit as st
import plotly.express as px
import plotly.graph_objects as go
import pandas as pd


COUNTRY_DATA = 'data/countries.json'
WORLD_HERITAGE_DATA = 'data/world_heritages.json'


def on_change_uploaded_file():
    st.session_state['need_rerun'] = True


def on_change_uploaded_file2():
    st.session_state['need_rerun2'] = True


def main():
    # Load country data
    countries = None
    with open(COUNTRY_DATA) as f:
        countries = json.load(f)

    country_list = [c['name_en'] for c in countries]
    default_visited_country = ['Japan']
    if 'default_visited_country' in st.session_state:
        default_visited_country = st.session_state['default_visited_country']

    name_alpha3_dict = {}
    for c in countries:
        name_alpha3_dict[c['name_en']] = c['alpha3']

    # Load world heritage data
    # Skip

    # UI
    st.title('訪れた国・世界遺産')
    st.write('訪れたことがある国や世界遺産を地図にプロットして可視化するサイトです。')
    st.write('どこを訪れたのか見返したい時に利用してください。')

    tab1, tab2 = st.tabs(["国", "世界遺産"])

    with tab1:
        st.write('### これまでに訪れた国はどこですか?')
        options = st.multiselect(
            '国名のリストから選択してください。',
            country_list,
            default_visited_country)
        uploaded_file = st.file_uploader("選択した国一覧の内容をダウンロードしたファイルからでも選択いただけます。",
                                         key='country',
                                         on_change=on_change_uploaded_file)
        uploaded_countries = None
        if uploaded_file is not None:
            uploaded_countries = json.load(uploaded_file)

        data = dict(country=[], country_code=[], number_of_visited=[])
        for c in options:
            data['country'].append(c)
            data['country_code'].append(name_alpha3_dict[c])
            data['number_of_visited'].append(1)
        if uploaded_countries is not None:
            for c in uploaded_countries:
                if c in name_alpha3_dict and c not in options:
                    data['country'].append(c)
                    data['country_code'].append(name_alpha3_dict[c])
                    data['number_of_visited'].append(1)
                    options.append(c)
        st.session_state['default_visited_country'] = options
        df = pd.DataFrame(data=data)

        st.write('### 選択した国一覧')
        st.download_button('Download', json.dumps(options), file_name='visited_countries.json')
        st.write(options)

        if 'need_rerun' in st.session_state and st.session_state['need_rerun']:
            st.session_state['need_rerun'] = False
            raise st.experimental_rerun()

        fig = px.choropleth(df,
                            locations='country_code',
                            hover_name='country')

        st.write('### 世界地図')
        st.write('地図にカーソルを合わせると表示されるカメラアイコンから画像を保存できます。また、左上右下の 2 方向の矢印のアイコンから拡大できます。')
        st.plotly_chart(fig, theme="streamlit", use_container_width=True)

    with tab2:
        # Skip


if __name__ == '__main__':
    main()
一点苦労した点としては、ファイルをアップロードした場合に地図が更新されなかった点です。
st.session_state で読み込んだファイルの内容を保持しておき、その状態で st.experimental_rerun で強制的にコードを再実行させることで、何とかなりました。