はじめに
tensorflowやtflearnでモデルを作っていると、ネットワークを図にしたり学習の進み具合をさくっとグラフにしてくれるツールがあると便利だな、と思ったことがあると思います。
Googleで検索をしているとtensorboardなるものを見つけたので、こちらを使って見たいと思います。
ちなみに、この記事の内容は以下のDockerイメージを使うことでさくっと試すことができます。

環境
ニューラルネットワークを簡単に作りたかったので、tflearnを使いました。
- OS : Ubuntu 16.04
- python : 3.5.2
- tensorflow : 1.1.0
- tfLearn : 0.3
- tensorboard : 1.0.0a6
tensorboardのインストール
tensorboardはpip installでインストールできるので、非常に簡単です。ただ、私の環境ではvirtualenvではうまく動作しなかったので注意してください。検索すると、既知の問題のようで、githubのissuesやstackoverflowのページがいくつかヒットします。
もしpython環境を整備していなかったらこちらを参考にしてみてください。
pip install tensorboard
サンプルニューラルネットワークの構築
MNISTデータセットを使って手書き数字認識のタスクをニューラルネットワークにやらせて、その様子をtensorboardで見たいと思います。
もしnumpy, tensorflow, tflearnをインストールしていなければ、pip installでインストールしてください。
構築するモデルは、入力層のユニットが784(28 x 28ピクセル)個、隠れ層は2層あって1つ目は128個、2つ目は32個のユニットがあります。そして最後に出力層が0から9の数字を表せられるように10個のユニットになっています。
図で表すと以下のようなネットワークになっています。

これをtflearnを使ってコードにすると以下のようになります。
import numpy as np
import tensorflow as tf
import tflearn
import tflearn.datasets.mnist as mnist

# 1. Load MNIST data
X_train, y_train, X_test, y_test = mnist.load_data(one_hot=True)

# 2. Build a NN Model
tf.reset_default_graph()
net = tflearn.input_data([None, X_train.shape[1]]) # Input Layer
net = tflearn.fully_connected(net, 128, activation='ReLU') # Hidden Layer 1
net = tflearn.fully_connected(net, 32, activation='ReLU') # Hidden Layer 2
net = tflearn.fully_connected(net, 10, activation='softmax') # Output Layer
net = tflearn.regression(net, optimizer='sgd', learning_rate=0.01, loss='categorical_crossentropy')
model = tflearn.DNN(net, tensorboard_verbose=3)

# 3. Traning
model.fit(X_train, y_train, validation_set=0.1, show_metric=True, batch_size=100, n_epoch=20)

# 4. Testing
predictions = np.array(model.predict(X_test)).argmax(axis=1)
actual = y_test.argmax(axis=1)
test_accuracy = np.mean(predictions == actual, axis=0)
print('Test accuracy: ', test_accuracy)
ディープではなくシンプルなニューラルネットワークで、しかもepochを20程度にしかしていません。それでも、私が試したときは約91%の正答率を出していました。
tensorboardでモデルと学習の様子を確認
tflearnを使うと/tmp/tflearn_logsにtensorboardで使えるログが勝手に出力されます。
tensorboardはWebUIで、以下のコマンドで立ち上げることが出来ます。ポート番号はデフォルトが6006なので、オプションで指定する必要はありません。
tensorboard --logdir='/tmp/tflearn_logs'; --port=6006
後はhttp://localhost:6006といったURLでアクセスするだけです。
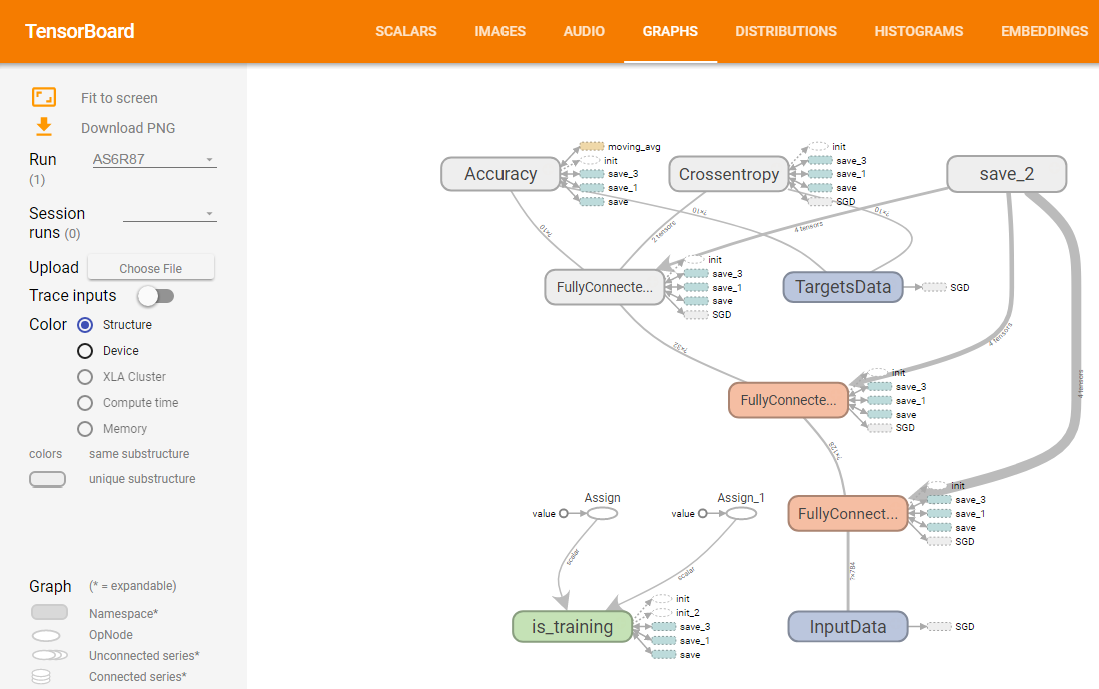
構築したニューラルネットワークはGRAPHSタブで確認できます。慣れるまでは若干見にくそうですが、トポロジ情報だけでなく学習方法など詳細な情報も含まれていて、コードを追うよりは簡単にモデルを把握することが出来ます。

学習の進捗の様子はSCALARSタブで確認出来ます。各層ごとに確認できるので便利ですね。

ちなみに、複数回実行すると、複数の結果を同時に見ることができます。
Jupyter Notebook上で構築したモデルを軽く見たい場合
tensorboardだと別タブでモデルを見ることになります。もしJupyter Notebookで、構築したモデルを見たい場合は、tfgraphvizというライブラリが使えます。
ただ、注意事項として、tfgraphvizの結果は特別見やすいわけではないです。あくまで理解の補助として利用いただければいいと思います。
これもインストールはpip installするだけです。
pip install tfgraphviz
tflearnでは結果が出力されなかったので、tensorflowで簡単なモデルを書いて出力させてみます。以下の例はこの記事の例を利用させていただいています。
import numpy as np
import tensorflow as tf

tf.reset_default_graph()

# Creating input and correct result data
x_data = np.random.rand(100).astype(np.float32)
y_data = x_data * 0.1 + 0.3

# Build network
W = tf.Variable(tf.random_uniform([1], -1.0, 1.0))
b = tf.Variable(tf.zeros([1]))
y = W * x_data + b
loss = tf.reduce_mean(tf.square(y - y_data))
optimizer = tf.train.GradientDescentOptimizer(0.5)
train = optimizer.minimize(loss)

# Output graph with tfgraphviz
tfg.board(tf.get_default_graph())
これをjupyter notebook上で実行すると、以下のような図が出力されます。

すごく見やすいわけではないですが、雰囲気はつかめるかと思います。
Dockerイメージ
この記事で紹介したことは、以下のDockerイメージですぐ試すことができます。
利用方法は以下のようにdocker pullしてdocker runするだけです。samples.ipynbファイルがあり、その中にこの記事で紹介したコードがすでにあるので、実行してみてください。
### Docker Pull
docker pull zuqqhi2/ml-python-sandbox:latest
docker images
#REPOSITORY                  TAG                 IMAGE ID            CREATED             SIZE
#zuqqhi2/ml-python-sandbox   latest              4402825ff756        2 hours ago         12.9 GB

### Run jupyter without login to container
docker run -it -p 8888:8888 -p 6006:6006 zuqqhi2/ml-python-sandbox
この記事がなんらかの参考になれば幸いです。

TensorFlowで学ぶディープラーニング入門 ~畳み込みニューラルネットワーク徹底解説~ posted with ヨメレバ 中井 悦司 マイナビ出版 2016-09-27 AmazonKindle楽天ブックス楽天kobo
I appreciate, cause I found exactly what I was looking for. You’ve ended my four day long hunt! God Bless you man. Have a great day. Bye
Wow, marvelous blog layout! How long have you been blogging for?you make blogging look easy. The overall look of your website is great, as wellas the content!
Hi,
I’ve reached out several times but haven’t heard back, which tells me one of three things:
1. You’re interested in giving link back, but haven’t had a chance to get back to me yet.
2. You’re not interested and want me to stop emailing.
3. You’ve fallen and can’t get up – in that case let me know and I’ll call 911.
Can you please reply with 1, 2 or 3? I don’t want to be a bother.
======================Original Message========================
Hi,
Saw your post on http://35.72.122.189/en/visualization-neural-network-training-using-tensorboard, and noticed that you’ve shared http://tflearn.org/.
Just thought that this piece on TENSOR I recently published might be valuable to your readers/followers as well.
https://www.guru99.com/tensorflow-tutorial.html
As a thankyou, I would be glad to share your page with our 31k Facebook/Twitter/Linkedin Followers.
Cheers!
Alex
Hi Alex,
Thank you for giving messages to me.
And I’m very sorry.
Just I was suffered from spams and I couldn’t find your comment.
Thank you for sharing your site.
I just took a look at but looks very useful!
About for your question, actually my answer is 1.
But now I’m a little worry about my article is a bit old in the area.
If you think my article is still useful for your followers, I’m very happy for your sharing to your followers.
Thank you.