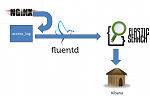
外観

ElasticSearchのインストール
$ wget https://download.elasticsearch.org/elasticsearch/elasticsearch/elasticsearch-0.90.7.zip
$ unzip elasticsearch-0.90.7.zip
$ sudo mv elasticsearch-0.90.7 /usr/share
$ sudo ln -s /usr/share/elasticsearch-0.90.7/bin/elasticsearch /usr/bin/elasticsearch
$ sudo vim /etc/init.d/elasticsearch
#! /bin/sh
### BEGIN INIT INFO
# Provides:          elasticsearch
# Required-Start:    $all
# Required-Stop:     $all
# Default-Start:     2 3 4 5
# Default-Stop:      0 1 6
# Short-Description: Starts elasticsearch
# Description:       Starts elasticsearch using start-stop-daemon
### END INIT INFO
ES_HOME=/usr/share/elasticsearch-0.90.7
ES_MIN_MEM=256m
ES_MAX_MEM=2g
DAEMON=$ES_HOME/bin/elasticsearch
NAME=elasticsearch
DESC=elasticsearch
PID_FILE=/var/run/$NAME.pid
LOG_DIR=/var/log/$NAME
DATA_DIR=/var/lib/$NAME
WORK_DIR=/tmp/$NAME
CONFIG_FILE=$ES_HOME/config/elasticsearch.yml
DAEMON_OPTS="-p $PID_FILE -Des.config=$CONFIG_FILE -Des.path.home=$ES_HOME -Des.path.logs=$LOG_DIR -Des.path.data=$DATA_DIR -Des.path.work=$WORK_DIR"

test -x $DAEMON || exit 0
set -e
case "$1" in
  start)
    echo -n "Starting $DESC: "
    mkdir -p $LOG_DIR $DATA_DIR $WORK_DIR
    if start-stop-daemon --start --pidfile $PID_FILE --startas $DAEMON -- $DAEMON_OPTS
    then
        echo "started."
    else
        echo "failed."
    fi
    ;;
  stop)
    echo -n "Stopping $DESC: "
    if start-stop-daemon --stop --pidfile $PID_FILE
    then
        echo "stopped."
    else
        echo "failed."
    fi
    ;;
  restart|force-reload)
    ${0} stop
    sleep 0.5
    ${0} start
    ;;
  *)
    N=/etc/init.d/$NAME
    echo "Usage: $N {start|stop|restart|force-reload}" >&2
    exit 1
    ;;
esac
exit 0
$ sudo chmod +x /etc/init.d/elasticsearch
$ sudo update-rc.d elasticsearch defaults
$ sudo /etc/init.d/elasticsearch start
Starting elasticsearch: started.
動作チェック
$ unset http_proxy
$ curl -X GET http://localhost:9200
{
  "ok" : true,
  "status" : 200,
  "name" : "Wolfsbane",
  "version" : {
    "number" : "0.90.7",
    "build_hash" : "36897d07dadcb70886db7f149e645ed3d44eb5f2",
    "build_timestamp" : "2013-11-13T12:06:54Z",
    "build_snapshot" : false,
    "lucene_version" : "4.5.1"
  },
  "tagline" : "You Know, for Search"
}%

#Input Date
$ curl -X PUT http://localhost:9200/foo/bar/1 -d '
>{
>  "user"    : "test",
>  "email"   : "test@gmail.com",
>  "body"    : "mastle body"
>}'
{"ok":true,"_index":"foo","_type":"bar","_id":"1","_version":1}%

#Search Data
$ curl -X GET http://localhost:9200/foo/bar/_search -d '
> {
>   "query":
>     {
>       "match" : {"user" : "test"}
>     }
> }'
{"took":52,"timed_out":false,"_shards":{"total":5,"successful":5,"failed":0},"hits":{"total":1,"max_score":0.30685282,"hits":[{"_index":"foo","_type":"bar","_id":"1","_score":0.30685282, "_source" :
{
  "user"    : "test",
  "email"   : "test@gmail.com",
  "body"    : "mastle body"
}}]}}%
Kibanaのインストール
$ git clone --branch=kibana-ruby https://github.com/rashidkpc/Kibana.git
$ sudo mv Kibana /usr/share
$ cd /usr/share/Kibana
$ bundle install
$ bundle exec ruby kibana.rb&
動作チェック
ブラウザで以下のURLにアクセスする。http://localhost:5601/

Nginxのインストール
$ sudo apt-get install nginx
$ sudo cp /etc/nginx/sites-available/{default,kibana}
$ sudo adduser nginx
$ sudo su - nginx
nginx@ubuntu:~$ mkdir html
nginx@ubuntu:~$ mkdir logs
nginx@ubuntu:~$ cd logs/
nginx@ubuntu:~/logs$ ls
nginx@ubuntu:~/logs$ cd ~
nginx@ubuntu:~$ ls
examples.desktop  html  logs
nginx@ubuntu:~$ exit
logout
$ sudo vim /etc/nginx/sites-available/kibana
server {
 listen 80; ## listen for ipv4; this line is default and implied
 listen [::]:80 default ipv6only=on; ## listen for ipv6
 root /home/nginx/html;
 access_log /home/nginx/logs/access.log;
 error_log /home/nginx/logs/error.log;
 index index.html index.htm;
 server_name localhost;
 location / {
 proxy_pass http://localhost:5601;
 }
 location /public {
 try_files $uri $uri/ /index.html;
 }
 error_page 404 /404.html;
 error_page 500 502 503 504 /50x.html;
}$ sudo rm /etc/nginx/sites-enabled/default
$ sudo ln -s /etc/nginx/sites-available/kibana /etc/nginx/sites-enabled/kibana$ sudo /etc/init.d/nginx restart
Restarting nginx: nginx.

$ sudo su - nginx
nginx@ubuntu:~$ ls
examples.desktop  html  logs
nginx@ubuntu:~$ cd html/
nginx@ubuntu:~/html$ ls
nginx@ubuntu:~/html$ mkdir public
nginx@ubuntu:~/html$ cd public/
nginx@ubuntu:~/html/public$ ls
nginx@ubuntu:~/html/public$ vim index.html
nginx@ubuntu:~/html/public$ cat index.html
<html><head></head><body><h1>Hello World!</h1></body></html>
動作確認

Fluentdのインストール
$ sudo apt-add-repository 'deb http://packages.treasure-data.com/debian/ lucid contrib'
$ sudo apt-get update
$ sudo apt-get install td-agent
$ sudo /usr/lib/fluent/ruby/bin/fluent-gem install fluent-plugin-elasticsearch
$ sudo vim /etc/td-agent/td-agent.conf
$ sudo cat /etc/td-agent/td-agent.conf
<source>
        type tail
        path /home/nginx/logs/access.log
        format nginx
        time_format %d/%b/%Y:%H/%M:%S %z
        tag nginx.access
        pos_file /var/log/td-agent/nginx.pos
</source>
<match nginx.access>
        index_name adminpack
        type elasticsearch
        include_tag_key true
        tag_key @log_name
        host 127.0.0.1
        port 9200
        logstash_format true
        flush_interval 10s
</match>
$ sudo /etc/init.d/td-agent restart
全体の動作チェック
- ブラウザでhttp://localhost/public/index.htmlにアクセスする。
- ブラウザでhttp://localhost/にアクセスしてKibanaの画面を見る。
- nginx.accessで検索する。
